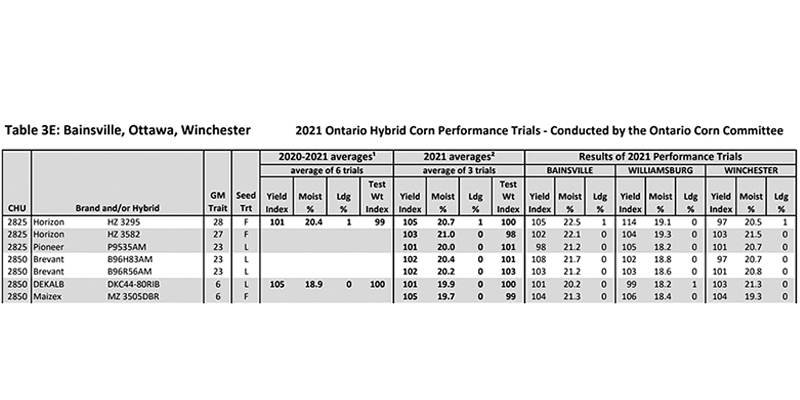
An example of the data that is displayed on GoCorn.net. Courtesy Photo
By Kelsey Banks, Agronomist
Kelseybanks3@gmail.com
For many growers, the same corn hybrid is chosen every year out of habit rather than data. For the most part, that sometimes works. However, it is important to look at the data behind the hybrids to choose the best corn hybrid that works for you and your farm business.
In Ontario, we are fortunate to be able to find most of the corn hybrid data on a website called gocorn.net. By clicking on ‘Hybrid Corn Performance Trial 2021’ then selecting ‘Area 3 East: Bainsville, Iroquois, Winchester’ in either an excel sheet, PDF, or graph format you can see the results of the variety from 2021.
At first, all of this data may look fairly daunting, however, once you understand the meaning and acronyms, it becomes a lot easier.
The first thing to look for is the corn heat units (CHU) that you typically purchase for your area. If you are unsure of what CHU, you should be looking for, there are updated CHU maps available on gocorn.net
For this situation, let’s say we are located in Morrisburg. Looking at this map, I am in the 2900 CHU area. Depending on if the corn will be going for feed or grain, the CHU and specific variety of the hybrid may change due to the amount of foliage.
Looking at the data for the hybrids you are looking at in the 2825 – 2850 CHU, you can see the data from the previous year’s corn performance trials that have been conducted by the Ontario Corn Committee.
The best way to explain the data that is being presented, is understanding what is being measured:
GM Trait
There are different codes for different types of genetically modified hybrids.
Seed Treatment
There are different seed treatments used typically based on the brand of the hybrid.
Yield Index
As stated in the Explanatory Package on GoCorn.net, “The index in the tables indicates a per cent of the average of all hybrids included in the trial(s). Index figures above 100 reflect the percentage by which a hybrid is above the average, and index figures below 100 show the per cent below average.”
Moisture %
“The accuracy of moisture measurement decreases as moisture content increases. Results for hybrids with very high moisture contents should be interpreted with caution.”
Lodging %
“Lodged Plants” includes plants with stalks that are broken below the ear and plants leaning such that the ear is in the adjacent row or otherwise unharvestable. Because all hybrids in a trial are harvested on the same date, the early hybrids within each table tend to show a greater amount of stalk breakage than do later hybrids. Stalk strength should be compared only with hybrids of the same maturity.”
Looking at the data being presented and while keeping your goals in mind, you can then select hybrids that may work for you.
Once you have narrowed your top four hybrids, you can see how they compare against each other using the Ontario Corn Committee ‘Corn Selector’ tool that is located on the homepage.
Although this data is important to keep in mind, it is also important to remember other factors, such as what your soil type is and what hybrids work best in your soil, your tillage type, cropping system and other factors that should be considered when making your corn hybrid decision.
To determine your next crop year’s corn hybrid, please contact your local agronomist.


